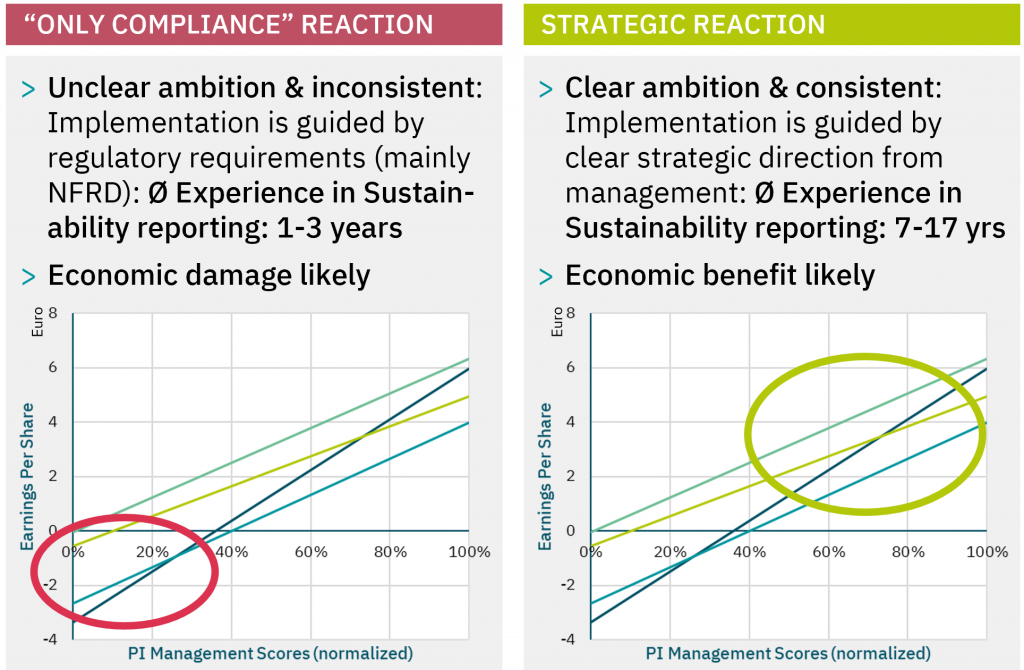
Problem: Regulation that implicitly “enforces” sustainability management risks costing money and time
EU reporting obligations on the wrong track
The NFRD:
> Transparency requirement: Mandatory reporting on sustainability management can lead to “only PR” to report on “activities” that are not practiced in the company at all1
CSRD, EU-Taxonomy, SFDR, CSDDD & Co:
> Im- and partly explicit management requirements remain and are even partly extended
> Inconsistent scope in accounting: partly separate topics for operations and suppliers, and above all: mixture of the upstream and downstream value chain (“as Scope 3”)
> Highly bureaucratic EU taxonomy, based on a planned economy approach, which starts with the current GDP split and sets deep-green performance requirements without context that are not applicable for “non-green” activities, ultimately making them cheaper
Why we need mandatory reporting: The Planetary Boundaries Model and key themes from it for reporting
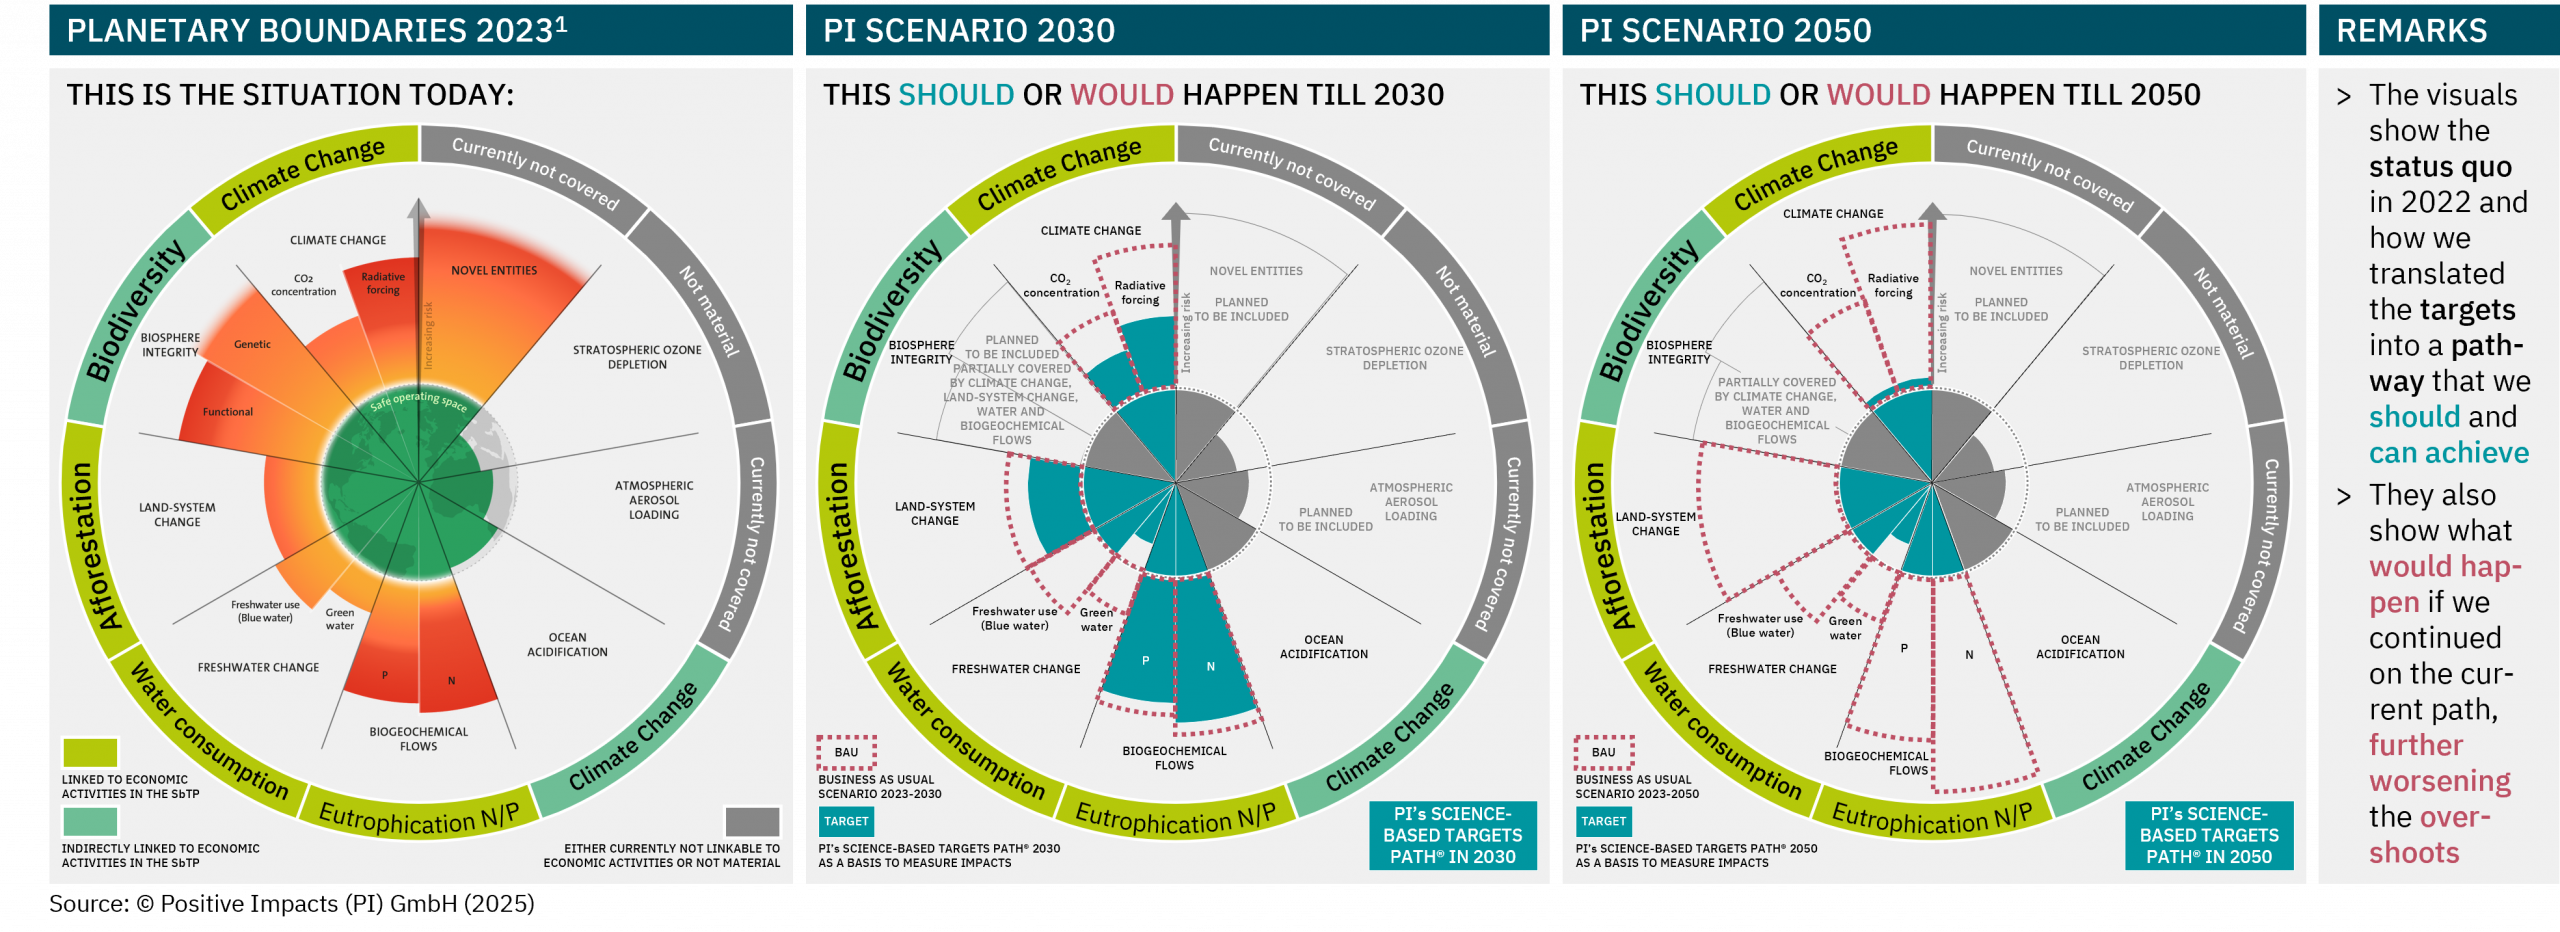
Source: © Positive Impacts (PI) GmbH (2025); Note: The Climate BAU used here would lead to a global warming to 3.43°C; 1) Credit: “Azote for Stockholm Resilience Centre, based on analysis in Richardson et al 2023”.
Proposal covers the 6 most important impacts on society
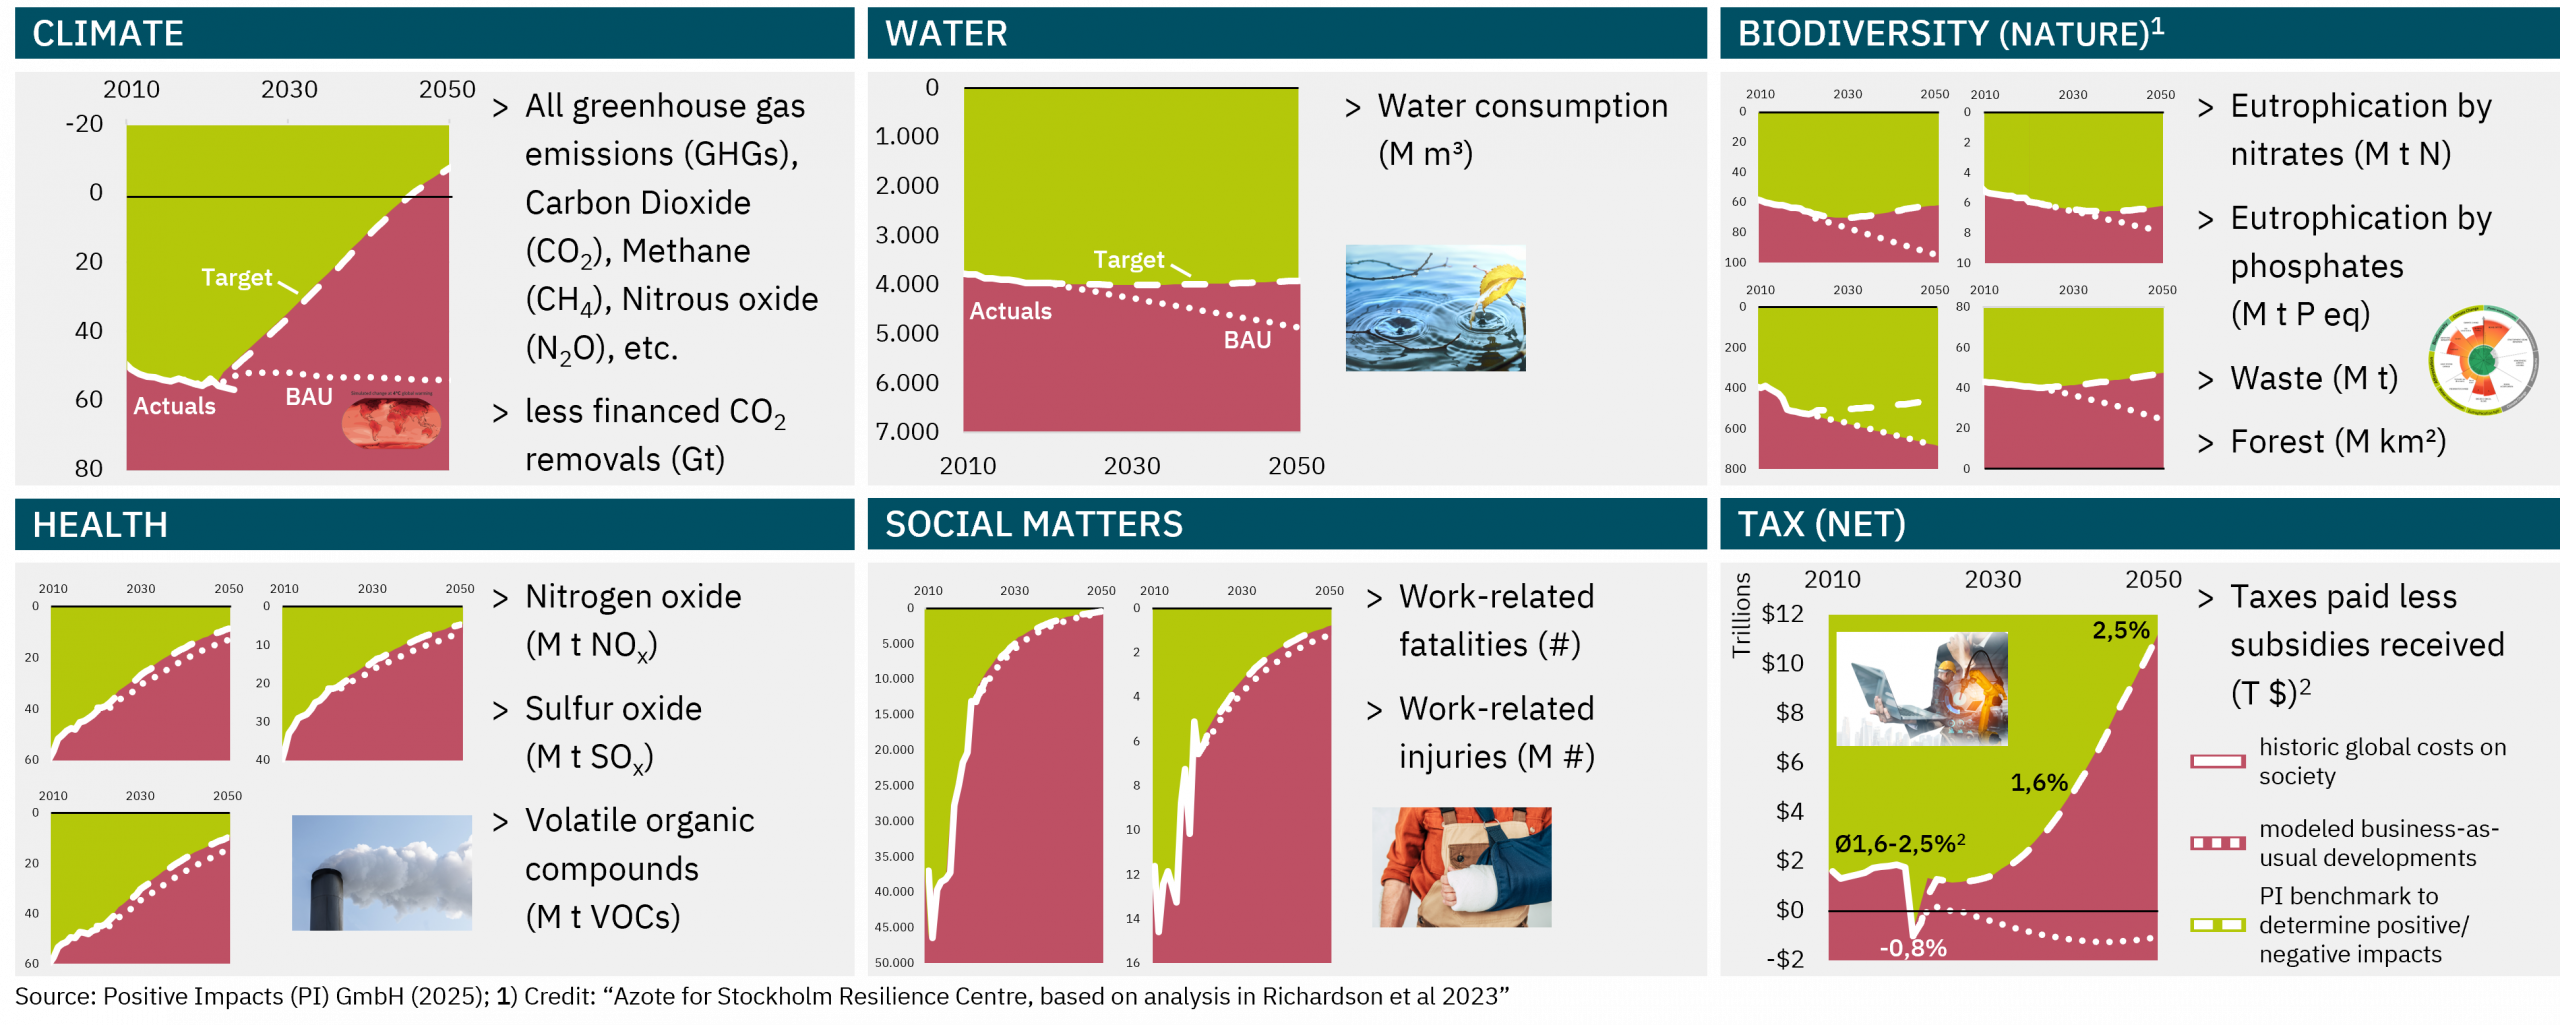
Source: © Positive Impacts (PI) GmbH (2025), based on data and targets derived by: IPCC AR6, UNEP, “Azote for Stockholm Resilience Centre, based on analysis in Richardson et al 2023”, ILO, IMF and OECD; 1) Please note that climate and water also represent leading indicators for impacts on biodiversity & nature, and that the indicators covered under nature are amongst the most relevant ones. However, lagging indicators such as ‘biodiversity loss could not be included as no company reports the number of species that got extinct due to their activities; 2) Based on historic global averages: Ø1.6-2.5% of global GDP.
Proposed topics, associated key indicators, and rationales for a mandatory reporting on them
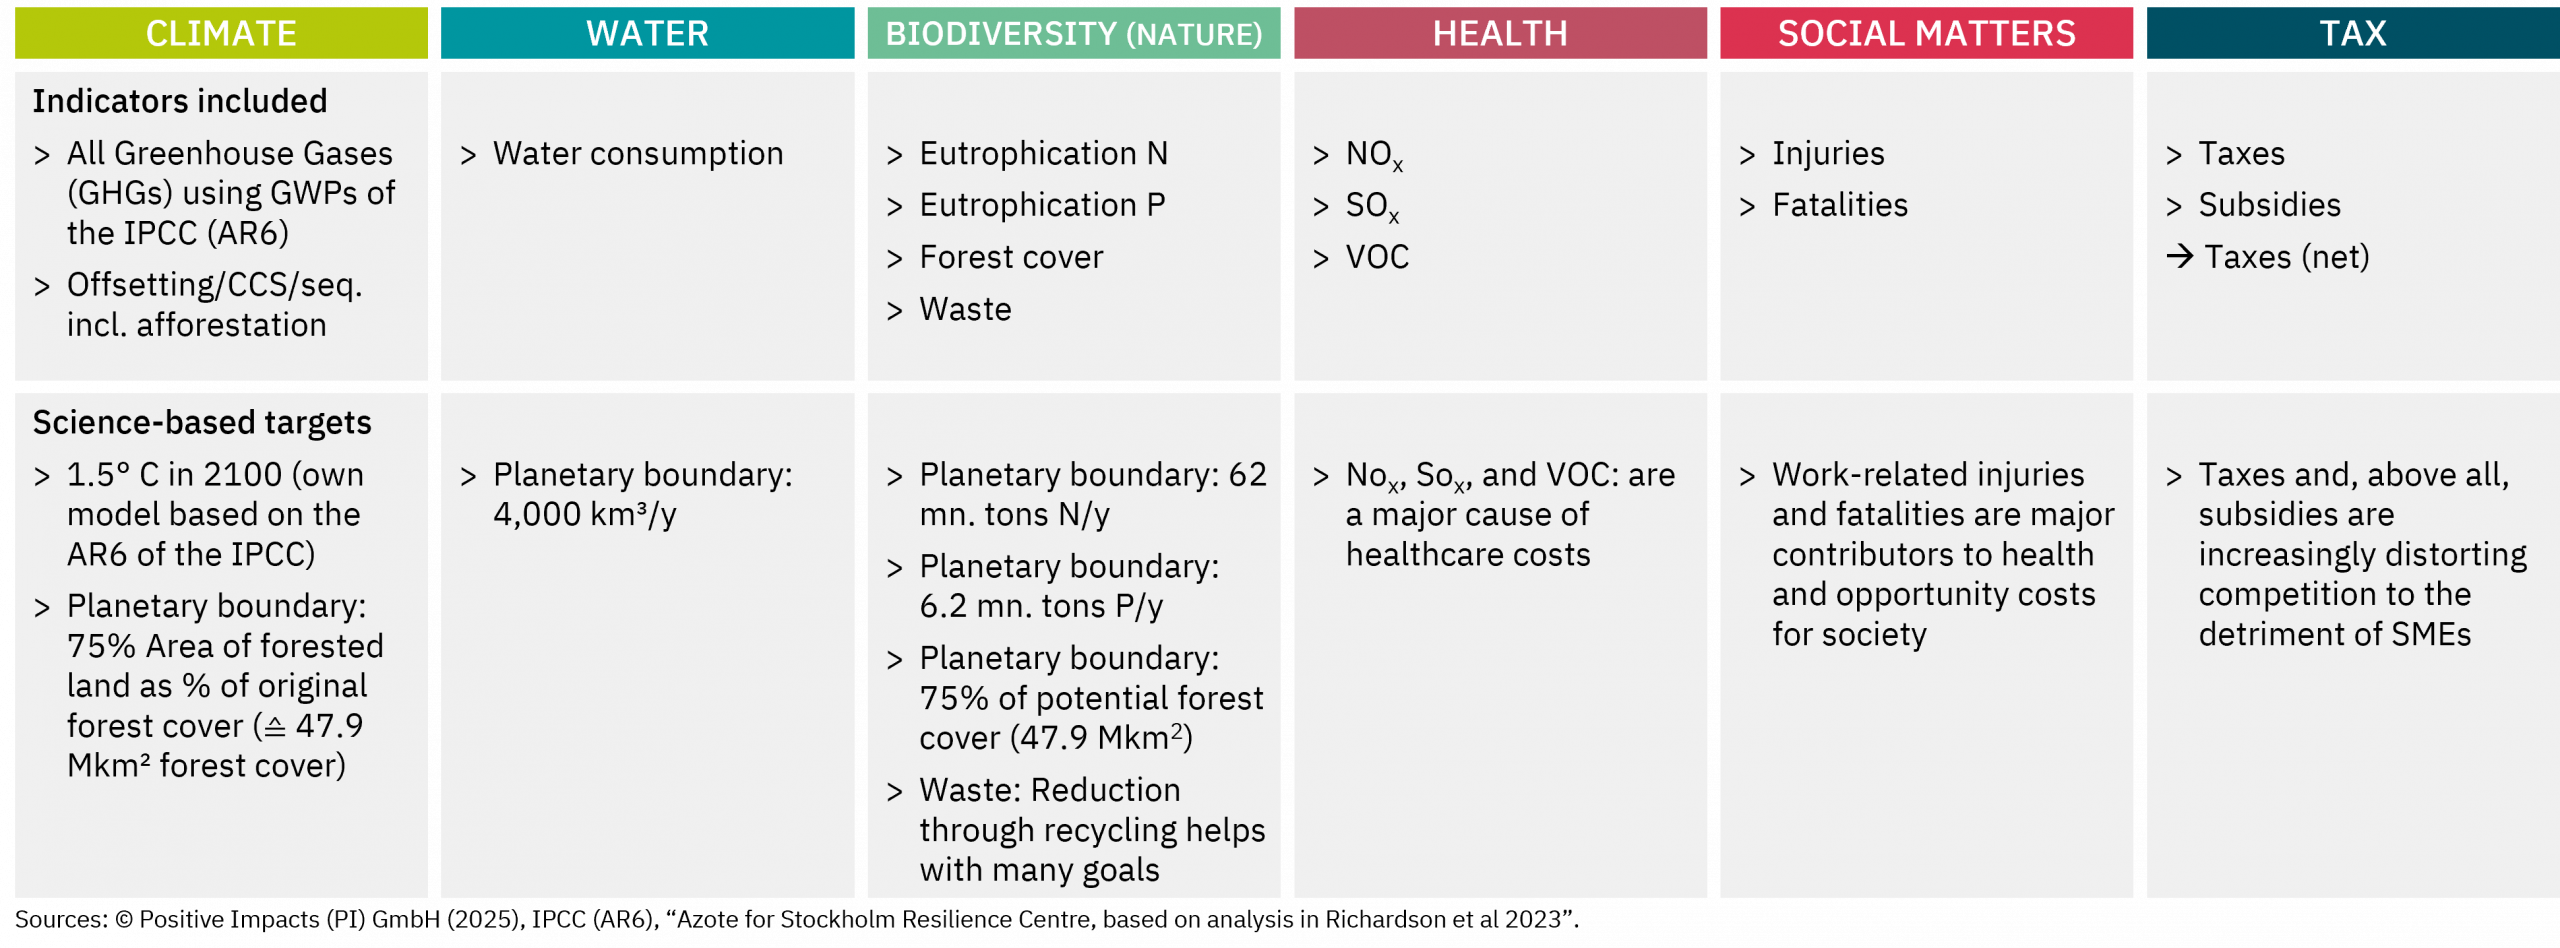
Source: © Positive Impacts (PI) GmbH (2025)